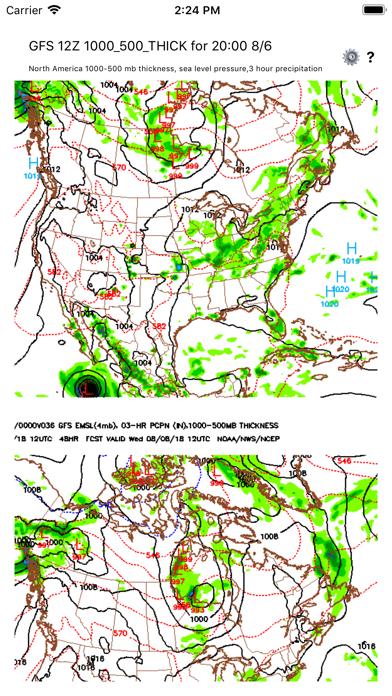
NOAA Forecast app for iPhone and iPad
Developer: Geoffrey Domm
First release : 12 Aug 2018
App size: 2.91 Mb
The NOAA Forecast app collects and displays weather maps produced by NOAAs Global Forecast System (GFS).
The maps are displayed in a scrollable and zoomable grid. The vertical axis of the grid is forecast time. Four different forecasts are displayed at 12 hour time intervals. The horizontal axis of the grid is different types of forecasts - five different types of maps can be selected from among 21 possible map types.
The maps are available for thirteen different regions of the globe.
These maps are the raw maps produced by the GFS computer model. The maps and the data contained in the maps are processed and interpreted by other weather services to produce the maps seen in the newspaper and on TV.
